Forms, types and methods of statistical observation. Data collection methods
Information (statistical data) is understood as a set of quantitative characteristics of mass objects obtained as a result of observation, its processing or calculations.
The main properties of statistical information are mass character And stability. The mass nature of information is related to the characteristics of the subject of statistics, while its stability lies in the fact that once collected information remains unchanged, i.e. capable of becoming obsolete.
The collection of statistical information involves statistical observation - a massive, systematic, scientifically based observation of objects, which consists in registering selected features for each of their units. It can be carried out by various organizations: statistical bodies, research institutions, economic services of stock exchanges, banks, firms. The process of its implementation consists of the following steps:
a) preparation of observation;
b) conducting mass data collection;
c) preparing the received data for processing;
d) development of proposals for improving surveillance.
Persons collecting information (registration of signs of object units) - observers - are also called registrars or counters.
The organization and conduct of monitoring involves the solution of the following issues:
1. Setting the purpose of observation. As a rule, the purpose of observation is most often practical - obtaining reliable information about the object in order to identify the patterns of its development.
2. Definition of the object of observation and establishment of the unit of observation. The object of observation is understood as a statistical set, where the processes and phenomena necessary for the study occur, under the unit of observation - an element of the object that is the carrier of signs subject to registration (for example, in such an object as a city, the unit can be enterprises, educational institutions, houses, residents and etc.).
3. Development of a monitoring program. The program is a list of signs subject to registration (questions that need to be answered) during observation (the so-called questionnaire). The program should contain signs that characterize the object, arranged in a certain order (questions can be closed - “yes-no”, test questions - choosing one answer from several, open - any answer to the question posed, etc.). The program is a statistical form - a document of a single sample.
4. Choice of place and time of observation. The place of observation is chosen depending on the purpose of observation, while the choice of the time for obtaining data is related to the solution of the following two questions:
a) establishment of a critical moment or interval of observation (day, hour or other period of time) for which (or, accordingly, during which) the registration of signs should be carried out for each unit of the study population);
b) determination of the observation period (the time required for mass data collection, which is determined based on the volume of work and the number of staff).
For example, when organizing population censuses, the critical moment is 0000 hours on the census date (population data are recorded as of that moment), and data collection is carried out within 10-14 days from this date.
When organizing observation, it is also necessary to determine its forms, methods and types.
In domestic statistics, the following three are most often used: FORMSstatistical observation:
1. Reporting. This is the main form of observation, with the help of which the statistical authorities receive from enterprises, organizations, institutions, firms and other economic entities data on the activities of the latter in the form of reporting documents in the prescribed manner within a certain period of time. Reporting is submitted for certain periods (monthly, quarterly, half-yearly - current) and once a year (annual). The reporting indicates the industry to which the enterprise belongs, its form of ownership, organizational and legal form, the number of employees, the volume of output, profitability and other data.
2. Specially organized statistical observation. It is carried out either in order to obtain information that is not in the reporting, or to verify it. A classic example censuses are such a form - observations repeated at regular intervals in order to obtain data on the number, composition and condition of the object (census of the population, material resources, perennial plantations, etc.).
3. Registers. This is a form of continuous statistical observation of long-term processes that have a beginning, a stage of development and an end. The register is a system that constantly monitors the state of the observation unit and takes into account the impact of various factors on it. There are population and business registers.
Population registers are named lists of residents maintained by region. A resident of a given territory who has a certain characteristic is entered in the register. If the registered person loses this sign, dies, moves to another region, he is excluded from the register (in the latter case, information about him is transferred to the register at the new place of residence). The most common population registers currently are:
but) marriage registry(here, the following signs are registered for persons at the place of residence: date and place of birth, gender, marriage and its dissolution, birth of children, death);
b) Pension Fund, registering persons who have reached retirement age (according to the main grid, men - 60, women - 55 years);
in) military registration and enlistment office, including those liable for military service (persons who have reached the draft age of up to 45 years) and military personnel;
G) Tax office, which registers taxpayers (owners of real estate, vehicles involved in entrepreneurial activity);
e) Enterprise Personnel Department where those who work on it are listed;
Along with the listed registers, there are many others, less significant.
Business registers contain data about the company and its economic activity(its name, address, form of ownership, legal form, ownership of capital, number of employees, industry sector, value of fixed assets, volume of output, its nomenclature, assortment, revenue, profit, profitability, etc.).
From WAYS Statistical observation is mainly distinguished:
1. Direct observation when the registrars themselves determine the fact to be recorded (for example, by measuring, weighing, counting, checking work, etc.) and making an entry in the observation form.
2. documentary way, based on the use of accounting documents as a source of information (data of interest to the observer are written out from the documents).
3. Survey, in which information is obtained from the words of the respondent (carrier of signs subject to registration).
The following types of surveys are most often used in statistics:
but) oral(forwarding), in which the registrar receives information directly from the respondent (in a conversation with him) and enters it into the form;
b) self-registration(the registrar distributes the forms to the respondents, explains the procedure for filling them out and collects the completed ones);
in) correspondent where forms mailed to the respondent are completed by the respondent and sent back to the organization conducting the observation;
G) questionnaire when the forms (questionnaires) handed over to the respondents are filled in by them voluntarily and anonymously;
e) secret, which provides for the provision by the respondent of information in person.
On the KINDS statistical observation is divided according to the time of registration of facts and the coverage of population units.
According to the time of registration of facts, the observation is:
1. Continuous (current), in which the change in the studied signs is fixed as it progresses.
2. periodic, which makes it possible to obtain data reflecting changes in an object during several surveys of it, carried out after a certain time.
3. lump sum, which gives information about the object only at the time of its study. So far, this object has not been surveyed, and its re-survey is not planned or may be carried out in an indefinite time.
According to the coverage of population units, the observation is divided into:
1. continuous, whose task is to obtain information about all units of the population without exception.
2. discontinuous, involving the examination of a part of the units of the population. Discontinuous observation does not give a sufficiently complete and reliable picture of the population, but is carried out in a more short terms and at lower cost. Non-continuous observation is divided into
but) selective based on the principle random selection of population units;
b) monographic, in which individual, specially selected units.
The considered forms, methods and types of statistical observation are three independent classifications of the information collection process. For example, a population census in form is a specially organized observation, in a method - a survey, and its expeditionary version, in terms of the time of registration of facts - periodic observation, in terms of coverage of population units - continuous.
The degree of compliance of the value of the indicator, determined on the basis of observation materials, with its actual value is called accuracy of statistical observation, and the discrepancy between the values of the quantities is observation error.
Methods for collecting statistical data
Statistical observation - the first and initial stage statistical study, which represents systematic, systematically organized on a scientific basis, the process of collecting primary data on various phenomena of social and economic life. Plannedness statistical observation lies in the fact that it is carried out according to a specially developed plan, which includes issues related to the organization and technique of collecting statistical information, controlling its quality and reliability, and presenting the final materials. Mass nature of statistical observation is ensured by the most complete coverage of all cases of manifestation of the phenomenon or process under study, i.e. in the process of statistical observation, quantitative and quality characteristics not individual units of the studied population, but the entire mass of units of the population. Systematicity of statistical observation means that it should not be carried out randomly, that is, spontaneously, but should be carried out either continuously or regularly at regular intervals.
The process of statistical observation is shown in Fig.1.
Fig.1. Statistical observation scheme
The process of preparing a statistical observation involves determining the purpose and object of observation, the composition of features to be recorded, and choosing the unit of observation. It is also necessary to develop forms of documents for collecting data and choose the means and methods for obtaining them.
Thus, statistical observation is a labor-intensive and painstaking work that requires the involvement of qualified personnel, its comprehensively thought-out organization, planning, preparation and implementation.
Types and methods of statistical observation
The task of the general theory of statistics is to determine the forms, types and methods of statistical observation to decide where, when and what methods of observation to apply. The diagram below illustrates the classification of types of statistical observation (Fig. 2).

Rice. 2. Classification of types of statistical observation
Statistical observations can be divided into groups:
- by coverage of population units;
- time of registration of facts.
With poor observation only a certain part of the studied population is covered, while it is important to determine in advance which part of the studied population will be subjected to observation and what criterion will be used as the basis for sampling. The advantage of conducting a non-continuous observation is that it is carried out in a short time, is associated with lower labor and material costs, and the information obtained is of an operational nature. There are several types of non-continuous observation: selective, observation of the main array, monographic.
Selective
called the observation of a part of the units of the study population, selected by random selection. At proper organization selective observation gives sufficiently accurate results that can be applied with a certain probability to the entire population. If sample observation involves the selection of not only units of the population under study (sampling in space), but also the points in time at which the registration of signs is carried out (sampling in time), such an observation is called the method of momentary observations.
Observation of the main array covers a survey of certain, the most significant in terms of significance of the studied characteristics of the units of the population. In this observation, the largest units of the population are taken into account, and the most significant features for this study are recorded. For example, 15-20% of large credit institutions are surveyed, while the content of their investment portfolios is recorded.
For monographic observation is characterized by a comprehensive and in-depth study of only individual units of the population that have some special characteristics or represent some new phenomenon. The purpose of such observation is to identify existing or only emerging trends in the development this process or phenomena. In a monographic survey, individual units of the population are subjected to a detailed study, which allows you to fix very important dependencies and proportions that are not detectable with other, less detailed, observations. Statistical monographic surveys are often used in medicine, when examining family budgets, etc. It is important to note that monographic surveys are closely related to continuous and selective surveys. Firstly, data from mass surveys are needed to select a criterion for selecting population units for non-continuous and monographic observation. Secondly, monographic observation makes it possible to identify character traits and essential features of the object of study, to clarify the structure of the studied population. The findings can be used as the basis for organizing a new mass survey.
By the time of registration of facts observation can be ncontinuous and discontinuous. Discontinuous, in turn, includes periodic and one-time. Continuous (current) observation is carried out by continuous registration of facts as they arise. With such an observation, all changes in the process or phenomenon under study are traced, which makes it possible to monitor its dynamics. For example, the registration of deaths, births, marriages by civil registry offices (ZAGS) is continuously conducted. The enterprises maintain current records of production, release of materials from the warehouse, etc.
Intermittent observation is carried out either regularly, at certain intervals (periodic observation), or irregularly, once, as needed (one-time observation). Periodic observations are usually based on a similar program and tools so that the results of such surveys can be comparable. An example of periodic observation may be a population census, which is carried out at sufficiently long intervals, and all forms of statistical observations that are monthly, quarterly, semi-annual, annual, etc. in nature. One-time observation is characterized by the fact that facts are recorded not in connection with their occurrence, but according to their state or presence at a certain moment or over a period of time. Quantitative measurement of signs of a phenomenon or process occurs at the time of the survey, and re-registration of signs may not be carried out at all or the timing of its implementation is not predetermined. An example of a one-time observation is a one-time survey of the state of housing construction, which was conducted in 2000.
Methods for obtaining statistical information
Along with the types of statistical observation, the general theory of statistics considers methods for obtaining statistical information, the most important of which are documentary method of observation, method of direct observation, survey.
Documentary observation is based on the use of data from various documents as a source of information, for example, accounting registers. Considering that, as a rule, high requirements are imposed on filling out such documents, the data reflected in them are of the most reliable nature and can serve as a high-quality source material for analysis.
Direct observation is carried out by registering the facts personally established by the registrars as a result of inspection, measurement, counting the signs of the phenomenon under study. In this way, prices for goods and services are recorded, measurements of working hours are made, an inventory of stock balances, etc.
Survey is based on obtaining data from respondents (survey participants). The survey is used in cases where observation by other methods cannot be carried out. This type of observation is typical for conducting various sociological surveys and public opinion polls. Statistical information can be obtained different types surveys: forwarding, correspondent, questionnaire, private.
Expeditionary (oral) survey is carried out by specially trained workers (registrators), who record the answers of respondents in the observation forms. The form is a form of a document in which it is necessary to fill in the fields for answers.
Correspondent poll assumes that, on a voluntary basis, the staff of respondents reports information directly to the monitoring body. The disadvantage of this method is that it is difficult to verify the correctness of the received information.
In a questionnaire survey respondents fill out questionnaires (questionnaires), voluntarily and mostly anonymously. Since this method of obtaining information is not reliable, it is used in those studies where it is not required high accuracy results. In some situations, there are enough approximate results that capture only the trend and record the emergence of new facts and phenomena. A face-to-face survey involves the submission of information to the bodies conducting monitoring, on a face-to-face basis. In this way, acts of civil status are registered: marriages, divorces, deaths, births, etc.
Forms of statistical observation
In addition to the types and methods of statistical observation, the theory of statistics also considers the forms of statistical observation: reporting, specially organized statistical observation, registers.
Statistical reporting is divided into specialized and standard.
The composition of indicators of standard reporting is the same for all enterprises and organizations, while the composition of indicators of specialized reporting depends on the specifics of individual sectors of the economy and areas of activity.
By submission deadline statistical reporting is daily, weekly, ten-day, fortnightly, monthly, quarterly, semi-annual and annual.
Statistical reporting can be transmitted by telephone, communication channels, on electronic media with mandatory subsequent submission on paper, certified by the signature of responsible persons.
Specially organized statistical observation is a collection of information organized by statistical authorities either to study phenomena that are not covered by reporting, or to study reporting data in more depth, verify and refine them. Various kinds of censuses, one-time surveys are specially organized observations.
Registers- this is a form of observation in which the facts of the state of individual units of the population are continuously recorded. Observing a unit of the population, it is assumed that the processes occurring there have a beginning, a long-term continuation and an end. In the register, each unit of observation is characterized by a set of indicators. All indicators are stored until the observation unit is in the register and has not ended its existence. Some indicators remain the same as long as the unit of observation is in the register, others may change from time to time.
So, the choice of types, methods and forms of statistical observation depends on a number of factors, the main of which are the goals and objectives of observation, the specifics of the observed object, the urgency of presenting results, the availability of trained personnel, the possibility of using technical means data collection and processing.
Program and methodological issues of statistical observation
One of the most important tasks that must be solved when preparing a statistical observation is to determine purpose, object and unit of observation.
Goals almost any statistical observation - obtaining reliable information about phenomena and processes public life in order to identify the interrelationships of factors, to assess the scale of the phenomenon and the patterns of its development. Based on the tasks of observation, its program and forms of organization are determined. In addition to the goal, it is necessary to establish the object of observation, that is, to determine what exactly is to be observed.
object observation is the totality of social phenomena or processes to be investigated. The object of observation can be a set of institutions (credit, educational, etc.), the population, physical objects (buildings, transport, equipment). When establishing the object of observation, it is important to strictly and accurately determine the boundaries of the population under study. To do this, it is necessary to clearly establish the essential features by which it is determined whether to include an object in the aggregate or not. For example, before testing medical institutions in terms of equipment modern equipment, it is necessary to determine the category, departmental and territorial affiliation of the clinics to be examined. When defining the object of observation, it is necessary to specify the unit of observation and the unit of the population.
Unit of observation
is an constituent element the object of observation, which is a source of information, i.e. the unit of observation is the carrier of signs to be registered. Depending on the specific tasks of statistical observation, this can be household or a person, such as a student, an agricultural enterprise, or a factory. Observation units are called reporting units if they submit statistical reports to the statistical authorities.
Population unit
- this is a constituent element of the object of observation, from which information about the unit of observation is received, i.e., the unit of the population serves as the basis for counting and has features that are subject to registration in the process of observation. For example, in a census of forest plantations, the unit of the population will be a tree, since it has characteristics that are subject to registration (age, species composition, etc.), while the forestry itself, in which the survey is conducted, acts as the unit of observation.
Each phenomenon or process of social life has many features, but it is impossible to obtain information about all of them, and not all of them are of interest to the researcher, therefore, when preparing an observation, it is necessary to decide which features will be subject to registration in accordance with the goals and objectives of the observation. . To determine the composition of registered features develop a monitoring program.
Statistical Observation Program
call a set of questions, the answers to which in the process of observation should form statistical information. The development of an observation program is a very important and responsible task, and the success of the observation depends on how correctly it is carried out. There are a number of requirements that need to be taken into account when developing an observation program:
- the program should, if possible, contain only those characteristics that are necessary and whose values will be used for further analysis or for control purposes. In an effort to complete the information that ensures the receipt of benign materials, it is necessary to limit the amount of information collected in order to obtain reliable material for analysis;
- program questions should be formulated clearly in order to exclude their incorrect interpretation and prevent distortion of the meaning of the information being collected;
- when developing an observation program, it is desirable to build a logical sequence of questions; questions of the same type or signs characterizing any one side of the phenomenon should be combined into one section;
- the monitoring program should contain control questions for checking and correcting the recorded information.
The statistical form is filled in according to the instructions. The instruction contains instructions on the procedure for conducting observation, guidelines and explanations for completing the form. Depending on the complexity of the surveillance program, the instruction is either published in the form of a brochure or placed on reverse side form. In addition, for the necessary clarifications, you can contact the specialists responsible for conducting the observation, the bodies that conduct it.
When organizing statistical observation, it is necessary to resolve the issue of the time of observation and the place of its conduct. The choice of the observation site depends on the purpose of the observation. The choice of observation time is associated with the determination of a critical moment (date) or time interval and the determination of the period (period) of observation. The critical moment of statistical observation is the point in time to which the information recorded in the process of observation is timed. The observation period determines the period during which the registration of information about the phenomenon under study should be carried out, that is, the time interval during which the forms are filled out. Usually, the observation period should not be too far from the critical moment of observation in order to reproduce the state of the object at that moment.
Issues of organizational support, preparation and conduct of statistical observation
For the successful preparation and conduct of statistical observation, the issues of organizational support must be resolved. To do this, an organizational plan of observation is drawn up, which reflects the goals and objectives of observation, the object of observation, the place, time, timing of observation, and the circle of persons responsible for conducting the observation.
An obligatory element of the organizational plan is the indication of the supervisory authority. It also defines the circle of organizations called upon to assist in the conduct of monitoring, these may include internal affairs bodies, the tax inspectorate, sectoral ministries, public organizations, individuals, volunteers, etc.
The preparatory activities include:
- development of forms of statistical observation, reproduction of the documentation of the survey itself;
- development of a methodological apparatus for analyzing and presenting the results of observation;
- development software for data processing, purchase of computer and office equipment;
- purchase of necessary materials, including stationery;
- training of qualified personnel, training of personnel, conducting various kinds of briefings, etc.;
- conducting mass explanatory work among the population and participants in the observation (lectures, conversations, speeches in the press, on radio and television);
- coordination of the activities of all services and organizations involved in joint actions;
- equipment for data collection and processing;
- preparation of information transmission channels and means of communication;
- solution of issues related to the financing of statistical observation.
Observation Accuracy and Data Validation Methods
Each specific measurement of the magnitude of the data, carried out in the process of observation, gives, as a rule, an approximate value of the magnitude of the phenomenon, which differs to some extent from the true value of this magnitude. The degree of compliance with the actual value of any indicator or feature obtained from observation materials is called the accuracy of statistical observation. The discrepancy between the result of observation and the true value of the magnitude of the observed phenomenon is called the error of observation.
Depending on the nature, stage, and causes of occurrence, several types of observation errors are distinguished (Table 1).

Table 1. Classification of observation errors
By their nature, the errors are divided into random and systematic . Random errors are called errors, the occurrence of which is due to the action of random factors. These include reservations and misprints by the interviewee. They can be directed towards decreasing or increasing the value of the attribute; as a rule, they are not reflected in the final result, since they cancel each other out during the summary processing of the observation results. Systematic errors have the same tendency to either decrease or increase the value of the indicator of the attribute. This is due to the fact that measurements, for example, are made by a faulty measuring device or errors are the result of an inaccurate formulation of the question of the observation program, etc. Systematic errors are of great danger, since they significantly distort the results of observation.
Depending on the stage of occurrence, registration errors are distinguished; errors that occur during the preparation of data for machine processing; errors that appear in the process of processing on computer technology.
Registration errors include those inaccuracies that occur when data is recorded in a statistical form (primary document, form, report, census form) or when data is entered into computer technology, data distortion when transmitted through communication lines (telephone, email). Often, registration errors occur due to non-compliance with the form of the form, that is, the entry was made in the wrong line or column of the document. There is also a deliberate distortion of the values of individual indicators.
Errors in the preparation of data for machine processing or in the process of processing itself occur in computer centers or data preparation centers. The occurrence of such errors is associated with careless, incorrect, fuzzy filling in of data in forms, with a physical defect in the data carrier, with the loss of part of the data due to non-compliance with the information base storage technology, or are determined by equipment failures.
Knowing the types and causes of observation errors, it is possible to significantly reduce the percentage of such information distortions. There are the following types of errors:
- measurement errors associated with certain errors that arise during a single statistical observation of the phenomenon and processes of social life;
- representativeness errors arising from non-continuous observation and related to the fact that the sample itself is not representative, and the results obtained on its basis cannot be extended to the entire population;
- deliberate errors arising from the deliberate distortion of data for various purposes, including the desire to embellish the actual state of the object of observation or, conversely, to show the unsatisfactory state of the object (this distortion of information is a violation of the law);
- unintentional errors, as a rule, of an accidental nature and associated with the low qualification of employees, their inattention or negligence. Often such errors are associated with subjective factors, when people give incorrect information about their age, marital status, education, belonging to social group etc., or simply forget some facts, giving the registrar information that has just come into memory.
- selection of qualified personnel and high-quality training of personnel related to the conduct of surveillance;
- organization of control checks of the correctness of filling out documents, by a continuous or selective method;
- arithmetic and logical control of the received data after the completion of the collection of observation materials.

Table 2. Types and content of control
Syntactic control means checking the correctness of the structure of the document, the presence of necessary and mandatory details, the completeness of filling in the form lines in accordance with the established rules. The importance and necessity of syntactic control is explained by the use of computer technology, scanners for data processing, which impose strict requirements on compliance with the rules for filling out forms.
Logical control checks the correctness of writing codes, compliance with their names and values of indicators. The necessary relationships between indicators are checked, answers to various questions are compared and incompatible combinations are identified. To correct errors identified during logical control, they return to the original documents and make corrections.
During arithmetic control, the obtained totals are compared with pre-calculated checksums for rows and columns. Quite often, arithmetic control is based on the dependence of one indicator on two or more others, for example, it is the product of other indicators. If the arithmetic control of the final indicators reveals that this dependence is not observed, this will indicate inaccuracy of the data.
Thus, the control of the reliability of statistical information is carried out at all stages of statistical observation, from the collection of primary information to the stage of obtaining the results.
Sociological research.
Desk and field studies have received the widest distribution in a comprehensive study of the market for mechanical engineering products. Desk research is the analysis of secondary information about the market, which is contained in official sources, statistical reference books, periodicals, brochures and bulletins. When using this method, general economic conditions for the functioning of external and internal markets are studied. Secondary information, as a rule, arrives late and must be clarified by primary information about the conditions for the sale of a particular product in a particular market or its segment and the reaction of consumers to it, as well as marketing activities of competing enterprises. Field research is the acquisition of primary information through questioning, demand, interviewing consumers, employees of intermediary organizations and sales services, as well as persons informing
During the survey, information is systematically collected from the interviewees through contact with them in person, by phone or by mail. A kind of survey is a questionnaire, the purpose of which is to identify the socio-psychological reaction of the population to various phenomena, events and activities. The survey procedure consists in the development and analysis of questionnaires. The survey can be conducted both orally and in writing. In the course of data analysis, forms are first coded and counted, and then they are studied. Coding is the process by which each completed form is numbered and the response categories are classified. The analysis consists in evaluating the responses, usually using statistical methods, related to the problem under consideration.
Exist various methods collecting economic data through surveys, questionnaires and interviews, obtaining official statistical reports, etc. Most countries have statistical offices that collect, process, disseminate and publish critical data. This activity is also carried out by many specialized public and private agencies.
Exist various ways collection of statistical data, census, statistical reporting of enterprises and organizations, surveys, questionnaires, customs and tax control, etc. Each method of data collection has its own shortcomings that cause errors in the values of empirical indicators. These errors can be divided into three groups. subjects for questions; and rounding errors. All these errors must be evaluated and taken into account in statistical data processing.
While having much in common with interview questions, biographical questionnaires differ from this method. According to Richard, the differences are that the collected data can be evaluated statistically, the applicant has the opportunity to avoid dislikes from the interviewer, the negative reaction cannot be overestimated. According to Shants, by structuring the information in the questionnaires, it is possible to avoid the obstacles that arise in the interview for an objective assessment of the candidate.
Marketing research is a separate scientific direction that has developed at the junction of a number of sciences. It has a rather complex methodology, which is a complex alloy of statistical, econometric, sociometric, qualimetric, behavioral and proper marketing methods. The collection of information is entirely subject to the rules
Statistical observation
Each statistical study includes three stages: statistical observation; statistical summary; statistical analysis. At the stage statistical observation primary information is collected about some mass phenomenon. At the same time, there must be requirements:
· representativeness- statistical observation should be massive;
· scientific validity- statistical observation should be carried out according to a previously developed plan and program.
IN general case The process of statistical observation includes the following steps:
preparation of observation;
conducting mass data collection;
preparation of data for processing, usually automated;
· Development of proposals for improving the organization and conduct of statistical observation.
Any statistical observation needs preliminary planning. Statistical observation plan includes:
· issues of methodology and organization of information collection;
control of its reliability;
The order in which the results are presented.
For questions information collection methodologies include:
determination of the purpose, object and unit of observation;
development of a monitoring program;
choice of form, type and method of observation.
The goal of any statistical observation is to obtain reliable information about the phenomenon under study. Depending on the goal, it is determined which phenomenon or process is to be observed, that is, the object of statistical observation. In the composition of the object of observation, the primary element is distinguished - unit of observation. Each such unit is a carrier of statistical characteristics subject to registration. For example, the purpose of a country's census is to obtain reliable data on the size, composition of the population, and living conditions. At the same time, the object of observation is the totality of all the inhabitants of the country, the unit is each individual person, and the registered features are his last name, first name, patronymic, gender, age, etc.
The unit of observation must be distinguished from reporting unit– the subject from which the observation data are received. In some cases, these units may not coincide. For example, when observing organizations in an industry in order to determine the total amount of their book profit for the reporting period, the unit of observation and the reporting unit are the same - this is a separate organization. It is both a carrier of the statistical feature "balance sheet profit" and a source for obtaining information about its value. However, when determining the concentration of capital investments in the industry, the reporting unit will still be a separate organization, and the unit of observation will be the facilities on which it conducts capital construction.
Observation program is a list of questions to be answered for each unit of observation. That is, in fact, the monitoring program is a set of statistical features to be recorded in the process of monitoring each unit.
The monitoring program includes the following requirements:
the presence of essential features that directly characterize the phenomenon under study, its main features and properties, and the absence of secondary features that are not related to the purpose of the study, or features whose values will be deliberately unreliable or inaccessible (for example, information that is the subject of a trade secret);
accuracy and unambiguity of questions, ease of understanding them;
a logical sequence of questions that ensures maximum reliability of answers;
the presence of control questions that allow you to check and clarify the data collected;
Formulation of all questions and answers to them in the form of a uniform document - statistical form. As a rule, such a document takes the form of a census questionnaire, questionnaire or form.
TO main organizational issues statistical observation includes the time and place of the observation. The choice of time involves the choice of a critical moment, the state at which the data is recorded, and the period during which the observation takes place. For example, a population census may be conducted from January 9 to January 31 of the current year, while January 1 of this year may be set as the critical moment. In such a case, for example, data on a child born on 8 January should not be recorded.
There are two options for monitoring the reliability of statistical observation data - logical And arithmetic.
Example 2.1. Census census data available:
1) surname, name, patronymic - Petrova Irina Vasilievna;
2) gender - male;
3) age - 5 years;
4) whether he is currently married - yes;
5) nationality - Russian;
6) native language- Russian;
7) education - specialized secondary;
8) place of work – secondary school;
9) position - teacher of elementary grades.
Let's check the presented data with the help of logical control. It is obvious that the content of paragraph 2 contradicts paragraphs 1 and 5, and the content of paragraph 3 contradicts paragraphs 4, 7 - 8. It is most likely that during the registration of data errors were made when indicating the sex and age of the respondent.
Example 2.2. The following data are available on the proceeds from servicing the population by the city's communication enterprises. Total revenue - 25.5 million rubles, including from the sale of envelopes, stamps, open and other goods - 15.0 million rubles, subscriptions to periodicals - 20.0 million rubles, sales of newspapers and magazines - 4.5 million rubles. Let's check this data.
The arithmetic control of the results of observation indicates the inequality of the total sales proceeds (25.5 million rubles) and the sum of its values for individual areas of sales (15 + 20 + 4.5 = 39.5 million rubles). The most likely explanation for this fact is an error in recording the amount of sales proceeds from the sale of envelopes, stamps, postcards and other goods. If we assume that its real value is 1.5 million rubles. (exactly an order of magnitude less than the registered value), the inconsistency of the observation results is eliminated.
If for any unit of the statistical population the values of individual features that are significant for the study are not fixed, then the observational data within this unit are incomplete and, therefore, cannot be recognized as reliable in general.
Forms, types and methods of statistical observation
Statistical observation can be organized in the form of reporting or specially organized observation.
Reporting- this is a legally defined form of monitoring the activities of organizations by providing them to the authorities state statistics information in the form of established reporting documents, the main of which are the balance sheet and income statement.
Specially organized statistical observation is the collection of information through specially organized censuses, one-time records and surveys.
According to the coverage of population units, two types of observation are distinguished: continuous and non-continuous. At continuous observation data are recorded for all units of observation, in case of non-continuous - for part of the units. An example of a specially organized continuous observation is the population census.
There are three types of non-continuous observation:
observation of the main array;
selective observation;
monographic observation.
At observation of the main array data are recorded for the most representative units. For example, observation of retail prices should not be carried out in all commercial enterprises, but in large stores and markets.
At selective observation units are selected randomly or mechanically (for example, every tenth unit). In this case, the sample size is determined based on the requirements for the accuracy and reliability of the observation results.
Monographic observation is a detailed observation of individual units. For example, observation of enterprises where a new production technology has been introduced, which has not yet become widespread, but is planned for mass implementation in case of successful testing.
There are three types of observation according to the time of conducting - continuous, one-time and periodic.
Continuous surveillance carried out when it is necessary to record all observed units as they occur. An example of such observation is a population survey conducted in public places. In this case, the units of observation - individuals, appear and are recorded (interrogated) continuously.
Single observation carried out as the need for data collection arises, and periodic- after certain periods of time. An example of a one-time observation is the population census. The preparation of the balance sheet in organizations is carried out quarterly and, in fact, is a periodic statistical observation.
Depending on the method of data registration, there are three methods of statistical observation - direct, documentary and survey.
At direct observation registration is carried out personally by the researcher by measuring, counting, weighing, etc. This method is the most reliable in terms of accuracy and reliability of the results, but requires high costs. This method of monitoring can include an inventory of fixed assets of the organization, when the actual availability of each accounted for is checked.
Documentary observation based on information obtained from various kinds of documents. It requires less cost and at the same time is quite reliable. On the basis of documentary observation, for example, financial statements are formed. In this case, the data contained in the primary accounting documents are used.
Survey comes down to filling out questionnaires. Its reliability depends on the clarity of the questionnaire (without double interpretation of questions and answers). Obviously, this is the least expensive method of observation, but also the least reliable.
Lecture 2 STATISTICAL SUMMARY AND GROUPING
Statistical summary
At the first stage of statistical research - the stage of statistical observation, for each unit of the statistical population, the values of a set of features are recorded. At the second stage, during statistical summary, this information is summarized by calculating the total values of features for all units and formatting them in a table.
According to the complexity of presenting information, there are:
· a simple summary when the totals are calculated immediately for the entire population;
· complex summary, when the units of the population are preliminarily grouped according to some attribute and the totals are calculated first by groups, and then for the entire population. An example of such a summary is presented in Table 3.1.
Table 3.1
Distribution of apartments in a residential building and
its tenants by the form of ownership of the apartment
Conducting a statistical summary allows you to organize disparate information about individual units of the population and move on to characterizing the entire population or individual groups of its units. For example, the summary presented in Table 1 makes it possible to distinguish two types of apartments according to the form of ownership and to conclude that private apartments predominate over municipal apartments both in terms of their number and the number of people living in them.
According to the form of processing the material, the summary is:
· centralized when all primary information enters one organization and is processed in it from beginning to end;
· decentralized, when information is first summarized simultaneously by different statistical bodies of the same level, and then the results obtained are received and summarized in a higher body.
According to the method of execution, the summary can be manual or automated i.e. performed by a computer.
Statistical observation
Statistical observation is a scientifically organized collection of quantitative data on phenomena and processes occurring in various fields of activity, by taking into account the primary data on each individual case or fact related to the phenomenon under study. Statistical observation is the first stage of any statistical work, as a result of which initial digital data are obtained.
Object of statistical observation is a certain phenomenon that is subject to observation.
The main task of statistical observation is to obtain reliable information to identify patterns of development of phenomena and processes.
Statistical research can be carried out successfully if the work on collecting information is thought out and properly organized. For this, a statistical observation plan is drawn up, consisting of program-methodological and organizational parts.
Program-methodological plan of observation includes the purpose and object of observation, the unit of observation, the program of observation and the organizational plan for observation (place, time of observation, timing of all work and other organizational issues of observation).
Before you start observing, you need to correctly determine its purpose. Purpose of statistical observation determined on the basis of the general tasks assigned to the statistical study of phenomena . For example, sales personnel can be studied by gender, age, education, classification, length of service, and so on. The warehouse distribution network needs to be studied in a different direction: the size of the warehouse area, specialization, equipment equipment, the level of mechanization of loading and unloading operations, turnover per 1 sq. km. m of warehouse space, etc. The purpose of statistical observation and its tasks should be determined by the needs of managing an economic entity.
Based on the developed monitoring program, a statistical form. This is a document in which all the questions of the program are stated in a certain sequence and where the answers to these questions are recorded. The statistical form has various names: report, form, census sheet, questionnaire, etc. Forms can be of two types: 1) card (individual) and 2) list. In the card form, information is recorded regarding one unit of the population. These include all kinds of questionnaires and individual forms. In the list form, information is recorded regarding two or more units of the population.
The next type of statistical work is summary and grouping collected data within each group and for the population as a whole. Processing of statistical material is carried out by constructing a series of figures, tables, graphs. Then go to the calculation summary indicators.
Mass phenomena studied by statistics as a set of phenomena of the same type, differing in individual characteristics, but having a common quality (development according to uniform laws), are called statistical aggregate. For example, the totality of the population or its individual contingents (pensioners, able-bodied population, students, etc.), the totality of industrial enterprises, etc. Population is a set of objects or phenomena of social life, united by a common connection. The objects included in the statistical population have several common features and may differ from each other by a number of other, secondary, features. The presence of versatile and diverse forms of relations and connections between them makes it possible to single out a number of particular statistical aggregates for the same objects. For example, from the general population of enterprises, firms, companies, etc. private aggregates can be distinguished first by one, then by another attribute, etc. (by form of ownership, by level of technology, by level of profitability).
Statistical aggregates characterize mass phenomena that are determined by place and time. The study of various statistical aggregates, associated with a quantitative characteristic and the identification of their inherent patterns in specific conditions of place and time, is the subject of statistics.
The study of statistics as a science is based on a system of categories and concepts that reflect the essential properties, features, relationships of phenomena and processes. The statistical population is one of the main concepts of statistical science. Other basic concepts are associated with the concept of "statistical population": "unit of the population", "statistical feature", "variation of features", "statistical indicator", "statistical regularity" and others.
The elements, the set of which forms the statistical population under study, are called population unit. Each unit of the population can be characterized by various kinds of qualitative (attributive) or quantitative signs, for example, in population statistics, signs are: gender, age, profession, education, etc. The population unit is the primary element of the statistical population, which is the carrier of the characteristics to be registered and the basis of the account maintained during the survey.
An important property of a statistical population is variation- differences in the values of the characteristics of the units included in the studied population. If a certain attribute has different values for individual units of the population, then it is said that it varies or has some variation.
Any statistical study (study of the statistical population) begins with the study of units of the population, with the registration of signs, the study of which is necessary to achieve the goal of the study.
The regularity revealed on the basis of mass observation is called statistical regularity.
Statistical indicator system, reflects the quantitative characteristics of various economic phenomena and processes, as well as the economy as a whole. The term "scorecard" refers to some ordered set interconnected And mutually agreed indicators characterizing the processes taking place in the economy and the economy as a whole. Consistency between the various indicators is achieved through the harmonization and coordination of definitions and classifications, on the basis of which they are calculated. Consistency of indicators allows using them in combinations, as well as calculating various derivative coefficients of great analytical value. For example, the consistency of methods for calculating the indicators of GDP and the state budget deficit makes it possible to determine the coefficient that characterizes the ratio of these values. Indicators of economic statistics characterizing the processes taking place in the economy form subsystems (blocks) common system economic statistics. Thus, the system of indicators of economic statistics is a set of interrelated subsystems of economic information, for example, such subsystems as the SNA, price statistics, financial statistics, etc.
Term "statistic" has two meanings. Firstly, this is a specific numerical characteristic of a particular phenomenon, for example, the population of Russia as of January 1, 1999 or the consumer price growth index for a particular period, etc. Secondly, this is a general definition of the content of a particular indicator, i.e. the elements that should be included in the indicator. For example, the definition of GDP establishes the types of payments made by enterprises and organizations that should be included in the calculation of this indicator. A statistical indicator is a generalized quantitative characteristic of phenomena and processes in unity with their qualitative certainty.
Determining the content of an indicator and methods for its assessment is usually called the development of a methodology, which, as a rule, includes the following steps:
1) identification of phenomena and processes subject to statistical study (determining the type of data that needs to be developed), formulating the goals for which certain indicators should be calculated (for example, the purpose of calculating GDP is to measure the production of goods and services, as well as economic growth rates) ;
2) determination of the content of indicators, for example, when calculating the indicator of national wealth, those types of economic assets that are to be included in this indicator must be precisely defined;
3) determination of methods for evaluating individual indicators;
4) determination of the main classifications that should be applied to distribute the studied economic phenomena into homogeneous groups based on certain criteria, for example, according to one of the most important classifications, the country's population is divided into social groups;
5) determination of the main sources of data necessary for the calculation of indicators, as well as procedures for processing the collected data in order to obtain generalizing indicators.
The degree of accuracy in calculating various indicators is different and depends on a number of factors: on the complexity of the phenomena being studied, the degree of difference in their characteristics, as well as on the requirements for data accuracy on the part of information consumers, which in turn depends on the purposes of their use. Many indicators are needed only to identify general trends in economic development.
The system of indicators of economic statistics must meet certain requirements in order to be able to describe and analyze economic development, and have inclusive character, i.e., extend to all processes occurring in the economy, and should also cover all business entities, all types of economic operations that they perform.
The system of indicators of economic statistics has a hierarchical structure. At the top of this system is a block of the most common macroeconomic indicators - SNA, consisting of subsystems, each of which is a more detailed description of certain aspects of the economic process. The SNA and its subsystems are connected with other blocks of economic statistics, which allows for a deeper analysis in a number of areas.
The concepts of a sign and a statistical indicator are interrelated and in some cases are used as identical.
Statistical observation can be organized in different ways. There are the following forms of organization of statistical observation:
1) statistical reporting provided by commercial and non-commercial enterprises, organizations, institutions;
2) specially organized statistical surveys;
3) registers.
The main, main form of statistical observation is statistical reporting. Reporting sources are primary accounting data (operational, accounting), which allow obtaining comprehensive information about the activities of enterprises, organizations, institutions. Reporting Forms(documents, forms containing a list of certain indicators, information characterizing an economic entity and the results of its activities) are developed and approved by state statistics bodies.
According to submission deadlines current reporting happens: daily, weekly, monthly, quarterly, semi-annual, annual.
Urgent reporting operates in cases where it is necessary to obtain information on the most important indicators of economic activity and is characterized by a short frequency of its provision: five days, ten days, fifteen days.
Annual reporting gives a complete, detailed, complete description of the state of activity of enterprises, firms, companies of various fields of activity and forms of ownership, organizations and institutions. Annual reporting clarifies the data of monthly and quarterly reporting, and the range of its indicators allows for an in-depth (detailed) analysis of the work of various commercial and non-profit enterprises, institutions, organizations.
Specially organized statistical observations conducted in cases where it is necessary to obtain information on indicators not provided for by statistical reporting.
Register - this is a named and constantly updated list of certain units of observation, created for continuous long-term statistical observation of a certain population. The register contains information about each unit of the population. The Unified State Register of Enterprises and Organizations of All Forms of Ownership (EGRPO) has been created in the Russian Federation, which is a reliable information base for maintaining the system of national accounts in the statistical practice of Russia and for conducting sample surveys of enterprises (as a general population) for various purposes.
The organizational part of the statistical observation program determines the place and time of observation, the form, type and method of observation, the coverage of objects of observation, methods of collecting data, etc.
If the objects under study can move, it is necessary to establish exactly where the object under study is to be observed (where the object can be most accurately accounted for). For example, in a population census, the place of observation is the place of residence.
Related to the question of the place of observation is the question of the division of the territory into census tracts. The boundaries of these divisions must be precise.
In statistics, there are objective and subjective observation time.
objective called time, to which this observation relates and characterizes the period or point in time as of which the signs of the population were collected and registered. So, for example, data on output, consumption, etc. can only be obtained for a certain period of time. Information about the population, the number of teachers, doctors, hospital beds, etc. can only be collected as of a certain date.
If the observation is timed to a certain moment, then it is critical moment. In this case, objective time is the critical moment.
The critical moment for each statistical observation is set on the basis of the specific features of the observed phenomena. For example, in a population census, the critical moment usually coincides with winter period, by the middle of the week, when the population is least mobile.
Subjective observation time is the time of observation, i.e. the period during which the units of the population are registered. So, if the deadline for submitting a report of an economic entity to the tax office for the first quarter is April 10, then the objective time is three months (January-March), and the subjective time is April 1-10, i.e. the time given for the preparation of the report.
In order to ensure the accuracy of the observation, subjective time should be measured in as short a period as possible. When the observation is based on documentary data, the length of subjective time is irrelevant.
Statistical observations are divided into a number of types according to time, scope and method of recording facts.
By the time of registration of facts Distinguish between current (continuous) and discontinuous (periodic and one-time) observation.
Current observation conducted systematically, continuously, as phenomena occur.
Single observation carried out once to solve a problem or repeated episodically after an indefinite period of time, as needed.
By coverage of population units Distinguish between continuous and non-continuous observations.
With total observation all units of the population are registered without exception. At the same time, in modern statistics, in a market economy, it is used on a large scale inconsistent observation. Non-continuous observation requires significantly less material and labor costs than continuous observation, allows the use of more advanced methods of accounting for facts, increases the operational significance of statistical materials, because it can be carried out in a shorter time. In a number of cases, non-continuous observation is the only possible one (when the observation process entails the destruction of the observed units).
With the main array method the main array is subjected to examination and part of the population is deliberately excluded. For example, monitoring of sales volume and prices in trade markets is carried out in 308 cities of the Russian Federation, which make up less than 5% of all cities in the country, but which are home to more than half of the total urban population, and such records are kept only in the main markets. This situation does not significantly affect the results of observation, since the main part of the population is examined.
With selective observation a part of the population units selected in a certain order is subjected to the survey, and the results obtained are applied to the entire population. Selective observation is based on the random selection of a certain part of the units of the studied population and the distribution of the summary characteristics (average and relative values) obtained as a result of the observation to the entire population.
Monographic observation (description). It consists of a detailed description and study of a small number of units (companies, banks, firms, enterprises, farms, etc.). Monographic observation is widely used by scientific institutions for a deep and comprehensive study of the characteristic features of the objects under study. So, of particular interest is a monographic study of any effectively operating company in order to study the ways and methods of its commercial activity.
Registration of the necessary information during statistical observation can be carried out using various sources of information.
Direct observation method is carried out by registering the units under study and their characteristics by the persons making the registration, on the basis of direct examination, counting, weighing, instrument readings, etc.
Documentary method of observation is used when enterprises (firms, companies, etc.), institutions and organizations fill out reports based on primary accounting documents, i.e. operational and accounting.
Both of these methods - direct observation and the documentary method - with the correct organization of observation, proper control over the setting of records and the correct filling of reporting forms, provide the greatest reliability of statistical data.
When polled statistical materials are obtained by recording the testimony given by the interviewed persons. The survey can be organized in different ways. There are four varieties of this method: forwarding (oral), questionnaire, correspondent and self-registration method.
Expeditionary method(oral questioning) consists in the fact that a specially designated person - the registrar - interrogates the person being examined and, from his words, fills out the survey form. At the same time, he simultaneously controls the correctness of the information received. This method provides fairly accurate results, but it is quite expensive. For this reason, it is used in the most important statistical surveys of the population (for example, population censuses).
Questionnaire method consists in the fact that the developed questionnaire is sent to a certain circle of people and after filling it is returned to the statistical authorities. Thus, this method is based on the principle of voluntary completion of special questionnaires (questionnaires) sent to persons from whom it is desirable to obtain information, with a request to fill them out and send them back.
Correspondent method consists in the fact that statistical and other bodies send specially designed forms and instructions for filling them out to individual organizations or specially selected persons who have agreed to periodically fill them out and send them to the statistical or other body within the prescribed time.
Self-registration (self-calculation) consists in the fact that employees of statistical bodies distribute questionnaire forms to the respondents, instruct them, and then collect the completed forms, controlling the correctness of filling in the information received. This method has found the greatest use in budget surveys of families, some censuses, and so on.
Economic statistics uses a variety of notation systems to facilitate the collection, processing and retrieval of data. The main notation systems are units of measurement, units of objects of administrative-territorial division, settlements, government bodies, enterprises and organizations, countries, currencies.
Statistical grouping AND SUMMARY
The material collected in the process of statistical observation is disparate primary digital information about individual units of the phenomenon (object) under study. The next stage of statistical research is summary And grouping information obtained as a result of the statistical observation.
Summary is a generalization of the obtained specific single facts that make up the statistical population, to determine typical features and patterns. This is a scientifically organized processing of statistical observation materials in order to obtain generalized characteristics of the phenomenon under study in terms of a number of signs that are essential for it.
grouping – this is the division of units of the population under study into groups that are qualitatively homogeneous in terms of certain characteristics that are essential for them. Grouping is one of the most methodologically difficult stages of statistical research. Identification of relationships between phenomena and their features is the main task of grouping statistical material; statistical grouping is the main method of scientific processing of statistical material.
In order to give a correct statistical interpretation of the collected materials, it is necessary to establish in advance a list of indicators, but which need to obtain summary data to characterize the phenomena under study. The development of a system of indicators is an essential part of a statistical summary. The basis of its development is the task of the study. Without a clearly formulated research task, without a deep knowledge of the phenomenon under study, it is impossible to build a system of indicators that most fully characterize this phenomenon. The final stage of the summary is the calculation of group and general totals and a graphical representation of the data obtained in the form of tables, charts, etc.
When building a grouping, you must select grouping attribute (grouping basis), which serves as the basis for the distribution of phenomena into groups, and determine the number of distinguished groups. The choice of a grouping attribute depends on the nature of the phenomena being studied and the goals of the grouping. The tasks of the grouping method are to determine the structure of the population, characterize the main types of phenomena and study their relationship.
The grouping features are subdivided into quantitative And qualitative (or attributive).
Fig.2.1. Types of grouping signs
Quantitative features have a numerical expression (the volume of output, the volume of fixed assets, the number of employees, the dollar exchange rate in rubles, the age of a person, the yield of grain crops, the amount of credit, the interest rate, etc.).
Attribute ( qualitative features ) do not have a quantitative expression, but reflect the state of the population unit (sex, nationality of a person, marital status, industry affiliation of a resident enterprise, etc.).
When analyzing phenomena, one often uses spatial groupings(on a geographical basis). The data of any grouping corresponds to a certain point in time or period.
When grouping according to a quantitative attribute, the question arises about the number of groups, which depends on the objectives of the study, on the grouping attribute, on the volume of the population, on the degree of variation of the grouping attribute.
The most commonly used method for calculating the number of groups is Sturgess formula:
n= 1 + 3.322lgN,
where n– number of groups;
N is the number of population units.
Depending on the research goals, the groupings can be used equal and unequal intervals: they are increasing and decreasing, open and closed. If equal intervals are applied, then their value can be calculated using the following formula:
x max is the maximum value of the attribute in the aggregate;
x min – the minimum value of the feature in the aggregate.
Groupings are the following species:
- typological: the purpose of such a grouping is to single out from a heterogeneous set of homogeneous groups of units, classes, socio-economic types;
- structural: this grouping divides a homogeneous population into groups that characterize its structure according to some changing feature;
- analytical: this grouping is used to identify the relationship and dependence between phenomena and their various features.
A statistical grouping based on one grouping feature is called simple. combinational grouping is based on several features.
In order to achieve comparability of data or for other analytical purposes, the units of the object are regrouped and secondary grouping(new groups are formed based on the previously produced grouping without recourse to primary data).
The results of the summary and grouping of statistical observation data are presented in the form statistical distribution series, which characterize the distribution of population units into groups according to one attribute.
Distribution series formed according to qualitative characteristics are called attributive. Grouping units of the population according to a quantitative attribute allows you to build variation series. A variational series can be built on a discrete or continuous basis. A discrete sign is expressed by a certain value, as a rule, in integers. A distribution series built on a discrete basis is called discrete variation series.
A continuous sign can take any intermediate values within certain limits. A distribution series built on a continuous basis is called interval variation series(in this row, as a rule, the variation of a trait is indicated as intervals "from" and "to").
Variation series consist of two elements - options and frequencies:
- variant (a specific value of a variable attribute),
- frequency (number of individual variants),
- the sum of frequencies (the number of the entire population,
- frequencies (frequencies expressed as fractions of a unit or as a percentage of the total).
An important task of statistical groupings is to identify and study the relationship and interdependence between phenomena. These links can be established with the help of analytical groupings based on interrelated features: factorial and effective. Factor signs cause changes in phenomena, and effective signs change under the influence of factors.
When the phenomena under study are grouped according to one attribute, even more so when two or three attributes are combined, a significant number of groups can be obtained (for example, when grouping the population by age, grouping trading firms according to the number of employees or the size of commodity turnover, etc.). If the attribute varies widely and has many different meanings, the question arises of defining grouping interval. After determining the number of groups, the grouping intervals are set.
Grouping interval - values of a variable characteristic that lie within certain limits. The resulting calculated value of the grouping interval is usually rounded off. Intervals have a lower and upper bound, or at least one of them. The lower limit of the interval is the minimum value of the feature, the upper limit is the highest value of the feature in the interval. The interval value is defined as the difference between the upper and lower limits of the interval.

Rice. 2.2 Grouping interval classification
Equal Spacing are applied when the change in the quantitative attribute inside occurs evenly. Unequal spacing are used in cases where the range of variation of a feature in the aggregate is large and the values of the feature vary unevenly. open name an interval for which only one boundary is indicated (for the first interval - the upper one, for the last interval - the lower one). Closed An interval has both upper and lower bounds. The results of statistical observation of summaries and groupings are usually presented in the form of tables, which make it possible to visualize the obtained numerical data. Columns (predicate) and lines (subject) form the layout of the table (Fig. 2.3.).
Table title (general title)
|
Subject heading |
Predicate heading |
|||||||||
|
Final line | ||||||||||
Fig.2.3. The layout of the constituent parts of the statistical table
Statistical subject of the table- this is what is said and what is characterized in the table. Statistical predicate of the table shows what features the subject is characterized by. For example, a comparison of the generalized results on the number of forest fires for the Moscow and Tver regions for 2000-2004. according to the EMERCOM of Russia is presented in table 2.1., and information about emergency situations that occurred on the territory of the Russian Federation for 2010 in table 2.2.
The classification of table types is shown in Figure 2.4. Such a division is made depending on the composition of the subject.

Fig.2.4. Classification of table types
IN simple table subject is not divided into groups. Since simple tables give only a summary and are not sufficient to identify the type of phenomenon under study, its structure and relationships, group and combination tables are used. group Tables are called in which the subject is divided into groups according to any one attribute. combinational such tables are called in which the subject is divided into groups not according to one, but according to several signs, and each group formed according to one sign is divided into subgroups according to another sign.
Table 2.1.
Comparison of the generalized results on the number of forest fires for 2000-2004. according to the EMERCOM of Russia for the Moscow and Tver regions
Table 2.2.
Information about emergencies that occurred in the territory Russian Federation for 2010
Basic rightsvilabuilding tables:
The table must have small size to make it easy to read and analyze;
The title of the table, the headings of the subject and the predicate must be precise, short and clear;
The table must clearly indicate the units of measurement, as well as the territory and period to which the data refer;
In the absence of data, a dash should be put, and in the absence of information, an ellipsis or “no information”;
In the table, the totals should be calculated;
Digital material should be given with the same degree of accuracy.
Generalizing statistics
Depending on the calculation methods, generalizing indicators can be absolute, relative or average values.

Rice. 2.5. Classification according to the method of generalization of the source data
Absolute statistics characterize the absolute dimensions of socio-economic phenomena, their signs in units of measures of length, area, mass (weight), etc., in monetary units or as the number of units of the statistical population.
The choice of units for measuring absolute statistical values depends on the socio-economic nature of the phenomenon under study. There are individual, group and general absolute values.
Individual absolute values characterize the size of a quantitative trait in individual units of the population and are the result of statistical observation.
Group and total absolute values obtained in the process of processing statistical observation materials by summing up the absolute dimensions of the feature for the units of the population included in separate groups or for the entire population as a whole.
Relative values are a measure of the quantitative ratio of statistical indicators and reflect the relative size of socio-economic phenomena. Relative values can be represented as ratios of the numbers of different sets of phenomena, their individual features, the sizes of different features of the same set, the ratio of planned and actual indicators.
The value with which the comparison is made is called basic(base of comparison or base). The value being compared is called current(reporting).
Depending on the tasks solved with the help of relative values, there are several types of them.
Relative value of the planned target (OVPZ) represents the ratio of the level of the planned indicator and the level of the indicator achieved in the base period:
 ,
,
P - the planned level of the indicator;
 - basic level of the indicator.
The relative value of the implementation of the plan (RTI) is the ratio of the actual value of the indicator in the current period and the value of this indicator, established according to the plan. OVVP characterizes the degree of implementation of the plan.
 ,
,
 - the actual level of the indicator achieved for the period;
P - the planned level of the indicator for the given period.
Relative value of dynamics (RTS) is the ratio of the actual value of the indicator for a given period to the base value of the indicator in the previous period. ATS characterizes the rate of change of the indicator over time, the rate of growth of the indicator.
 ATS = (F 1 / F 2) 100%
The relative values of the planned task, the fulfillment of the plan and the dynamics are interconnected by the relation
ATS=OVVP×OVPZ,
those. 
Relative Structure Value (RVS)- expresses the relationship of the part and the whole to each other. RBC characterizes the structure, composition of the studied population.

Relative Coordination Value (RVR) expresses the ratio of the individual parts of the whole to each other. It shows how many units of one part of the whole fall on the unit of its other part, chosen as the base of comparison.
Relative intensity value (RVI) expresses the ratio of the sizes of two qualitatively different phenomena. JVI characterizes the degree of spread of the phenomenon in a certain environment, for example, demographic coefficients - fertility, mortality, natural increase, marriage, etc. For ease of interpretation of the calculated JVI indicators, they are most often expressed in ppm.
Relative value of the level of economic development expresses per capita production of various products (used for international comparisons) and is a kind of relative intensity value.
Relative Comparison Value (RVRcomp.) expresses the ratio of similar indicators related to different objects or different territories (for example, a comparison of the volume of production of refrigerators in Russia and the USA).
Along with absolute and relative values, average values are of great use in statistics. For example, average price, average consumption of products, average wages, average equipment capacity, average output, average savings, etc.
average value is a generalizing quantitative characteristic of homogeneous phenomena according to some varying attribute.
The average value is the most common statistical indicator, which characterizes the totality of the same type of phenomena according to a quantitatively varying attribute. It shows the level of the attribute per population unit. With the help of averages, various aggregates are compared according to varying characteristics, the patterns of development of phenomena and processes of social life are studied.
In statistics, two classes of means are used: power And structural.

Rice. 2.6. Average classes
General formula for power mean has the following form:
 ,
,
 - power mean;
X i ={X 1 ; X 2; ¼ X n) - variants (numerical values of the attribute for units of the population);
 - frequencies showing how many times the corresponding value of the attribute occurs in the units of the population;
m is the exponent of the power mean.
The choice of the type of average in each particular case is determined by the purpose of the study and the nature of the available initial data. The average value is a generalizing characteristic of the population and the value is abstract, not concrete, since it smooths out individual values of the units of the population that have deviations in one direction or the other.
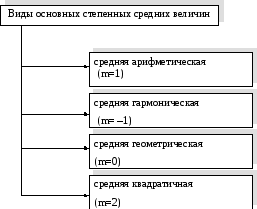
Fig.2.7. Types of basic power averages
simple arithmetic average.
 ,
,
 - the average value of the variable feature, i.e. simple arithmetic mean;
 - individual values of a variable attribute, which are called variants;
 - number of population units.
Arithmetic weighted average.
 - as before, options;
 - frequency.
The weighted arithmetic mean is the quotient of dividing the sum of the products of the variants and their corresponding frequencies by the sum of all frequencies.
Frequencies  , appearing in the average formula, is usually called scales, as a result of which the arithmetic average, calculated taking into account the weights, is called the weighted average.
However, in some cases there are no absolute frequencies, but relative frequencies are known, or, as they are commonly called, frequency, which show the share or specific gravity frequencies across the board.
Basic properties of the arithmetic mean:
1. The sum of deviations of a variant from their arithmetic mean is equal to zero.
2. If all options are reduced or increased by the same constant number, then the arithmetic mean of these options will decrease or increase by the same number. For example, if wage of each employee of the company increased by 150 rubles over a certain period, then the average wage of all employees of the company also increased by 150 rubles.
3. If all options are equally increased (or decreased) by the same number of times, then the arithmetic mean will increase (or decrease) by the same amount. For example, if the salary of each employee of the firm increased by 10%, then the average salary of all employees of the firm would increase by 10%.
4. If all the average weights are equally increased (or decreased) several times, the arithmetic mean will not change.
An increase in all weights by several times leads to the fact that both the numerator and the denominator of the fraction (arithmetic mean) will increase by the same amount, so the value of the fraction does not change.
 Delicious and Easy Pear Pie Pear Pie Recipes Easy at Home
 Flourless syrniki - step by step cooking recipes with semolina, oatmeal or starch with a photo Delicate syrniki without flour
 Shchi ingredients. Shchi from fresh cabbage. Prepare a stir fry